Project area/S
- Pulsars and Fast Transients
Project Details

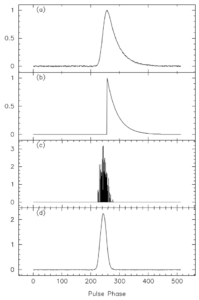
An example of the deconvolution technique applied to simulated data (from Bhat et al., 2003) and its ability to reconstruct the intrinsic pulsar profile (d) from the observed data (a) and the “pulse broadening function” characteristic of the interstellar medium (b). Eval-uating how these recovered profiles evolve with frequency, compared to how we typically expect them to change will allow us to quantify how much the deconvolution technique biases the intrinsic pulsar signal.
Pulsars allow us to probe many different aspects and scale sizes in physics and astrophysics. One axis upon which pulsars allow unprecedented precision is in measuring the characteristics of the ionised interstellar matter (ISM) between Earth and the pulsar on micro-arcsecond (sub-AU size) scales, which is not possible using any other observational probes currently available.
This ionised matter imparts specific observational signatures on the received pulsar signal (a phenomenon called multipath scattering), which can be used to probe the ISM along pulsar-Earth sightlines. In principle, deconvolution techniques can be employed to reconstruct the intrinsic pulsar signal, but its efficacy has not been convincingly demonstrated. In the present era of wideband observing technologies and instrumentation, the effects on the intrinsic pulsar signal evolution as a function of observing wavelength is incredibly important because multipath scattering is strongly wavelength dependent.
This project will explore how these two disparate but intertwined physical effects bias the results from the deconvolution process – something that has not been quantified, but which is of significant interest to both pulsar and ISM communities, and potentially FRB (fast radio burst) research as many of the bursts appear measurably broadened in observations.
Student Attributes
Academic Background
Enrolment in any Physics course is appropriate. The applicant should have an interest in astrophysics, but it is not required to be enrolled in an astronomy stream.
Computing Skills
Unix operating systems, Python, Bash
Training Requirement
None
Project Timeline
| Week 1 | Inductions and project introduction |
| Week 2 | Initial presentation |
| Week 3 | Demonstrating basic method on simulated data |
| Week 4 | Demonstrating basic method on real data (single pulsar) |
| Week 5 | Demonstrating method on real date over multiple frequencies (single pulsar) |
| Week 6 | Exploring biases, trends between frequencies |
| Week 7 | Exploring biases, trends between frequencies |
| Week 8 | Quantify results, formalise method to examine/extract bias |
| Week 9 | Final presentation |
| Week 10 | Final report |

