Please credit all video use as follows: Created by Paul Bourke from 6df Galaxy Survey data.
Created by Paul Bourke from The University of Western Australia, this is a visualisation of the galaxies surveyed in the 6dfGS. This is the survey data that was used to measure the Hubble constant with no systematic errors and excellent accuracy by ICRAR/UWA PhD Candidate Florian Beutler.
Related still images
Please credit all 6df GS image use as follows: ‘Created by Chris Fluke, Centre for Astrophysics & Supercomputing, Swinburne University of Technology.’
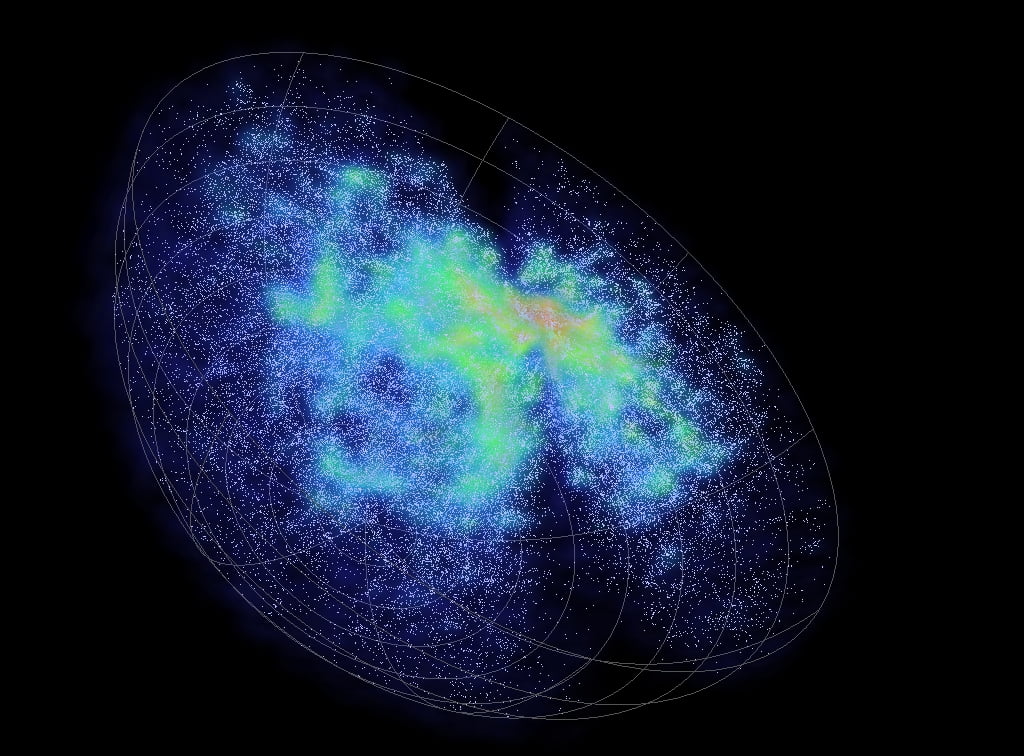
6df Galaxy Survey data, each dot is a galaxy and Earth is at the centre of the sphere.
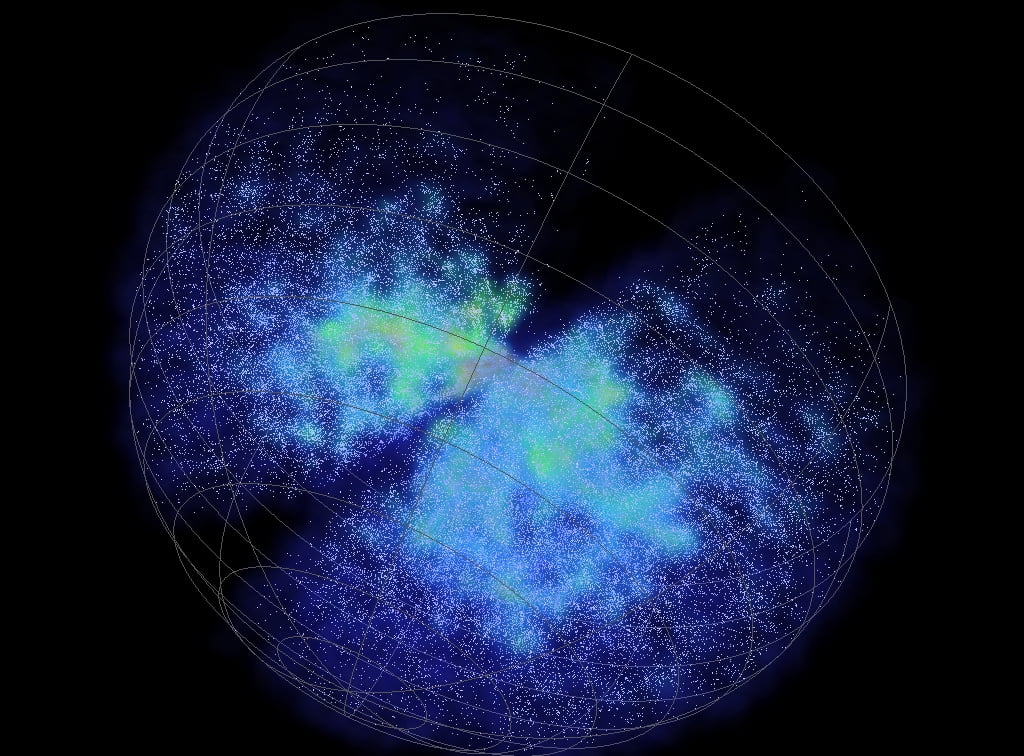
6df Galaxy Survey data, each dot is a galaxy and Earth is at the centre of the sphere.
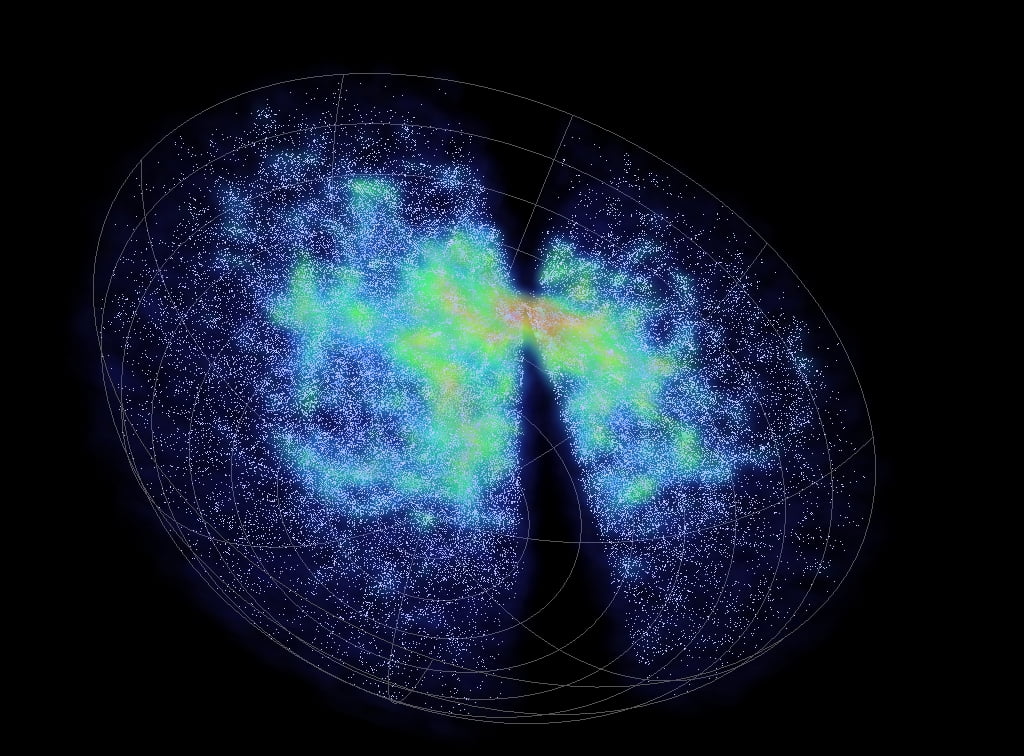
6df Galaxy Survey data, each dot is a galaxy and Earth is at the centre of the sphere.
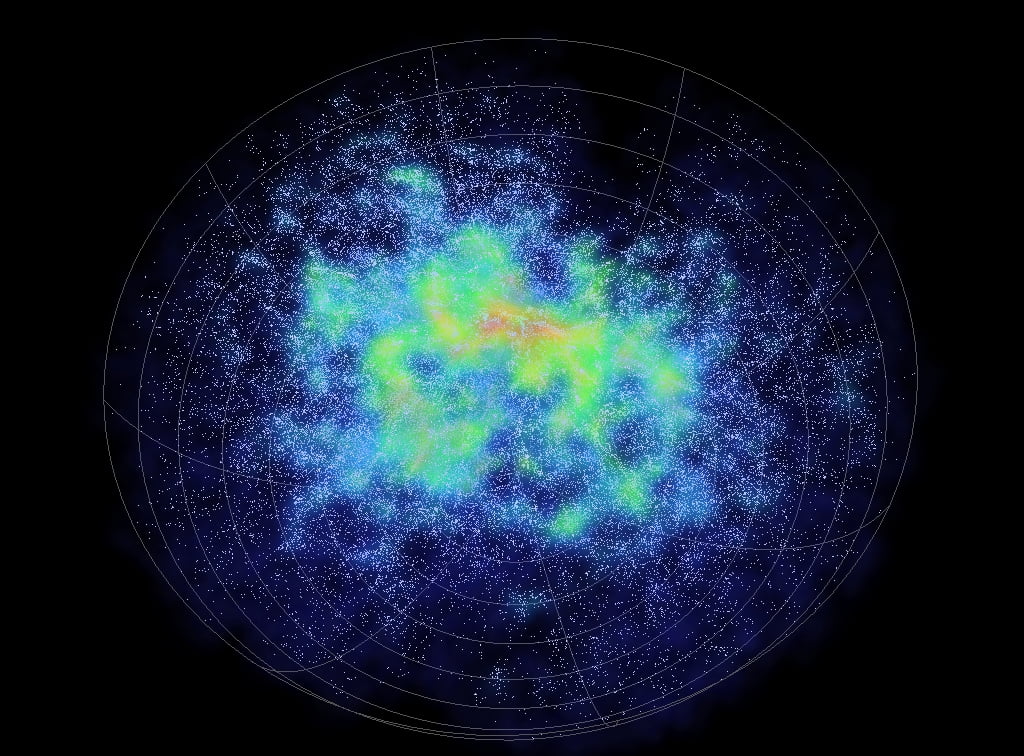
6df Galaxy Survey data, each dot is a galaxy and Earth is at the centre of the sphere.
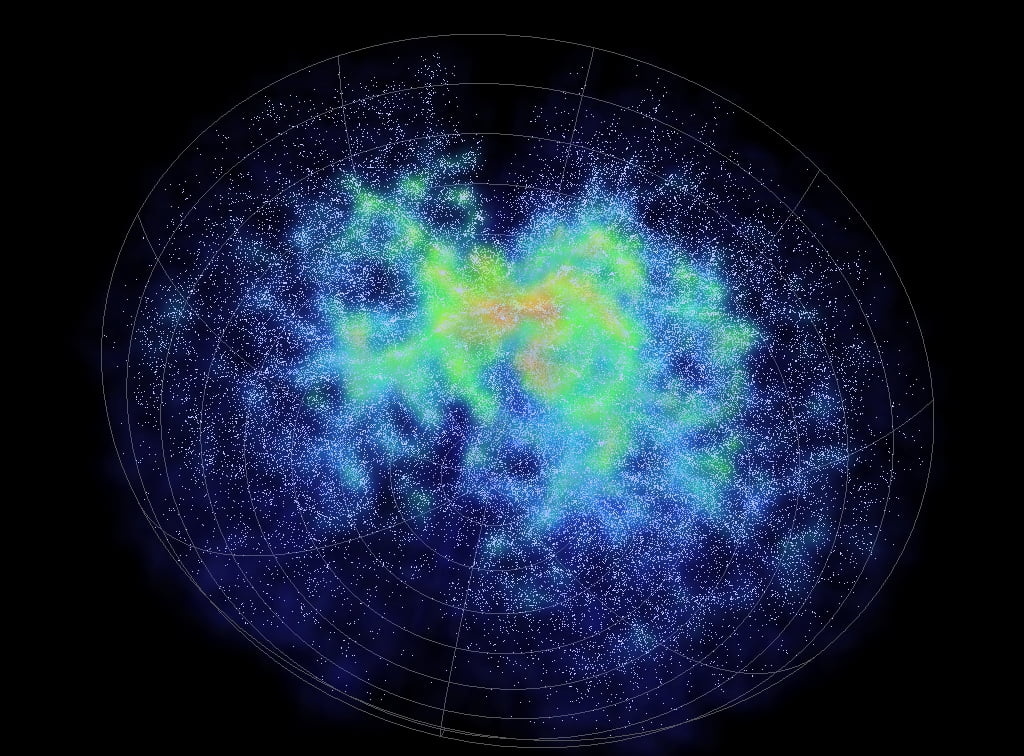
6df Galaxy Survey data, each dot is a galaxy and Earth is at the centre of the sphere.
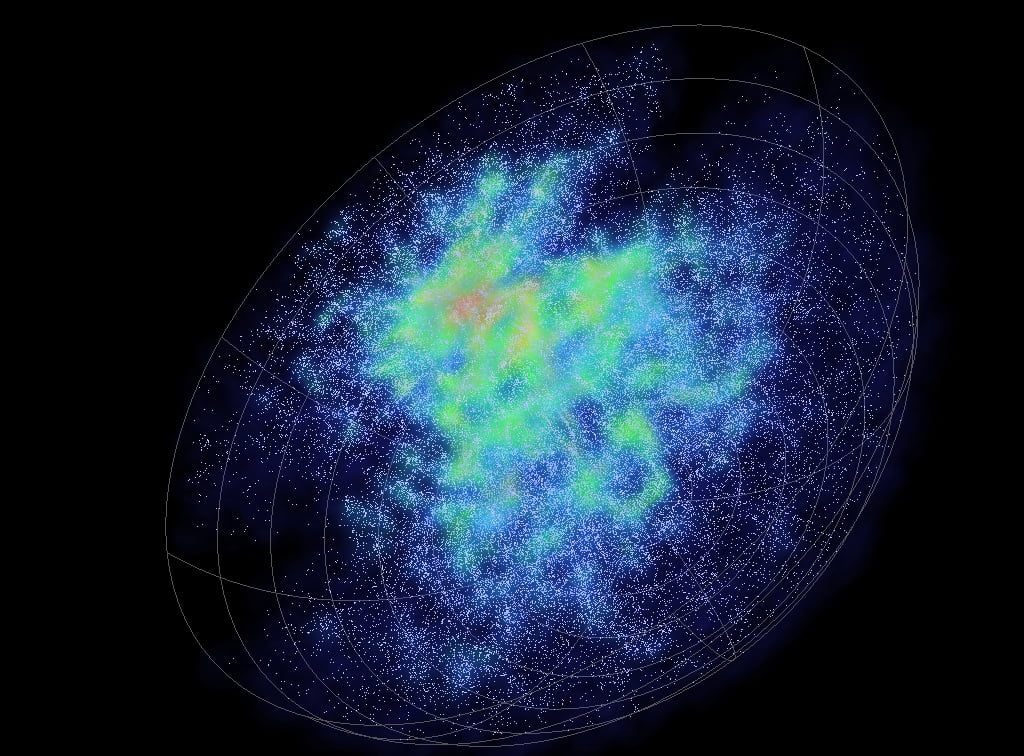
6df Galaxy Survey data, each dot is a galaxy and Earth is at the centre of the sphere.
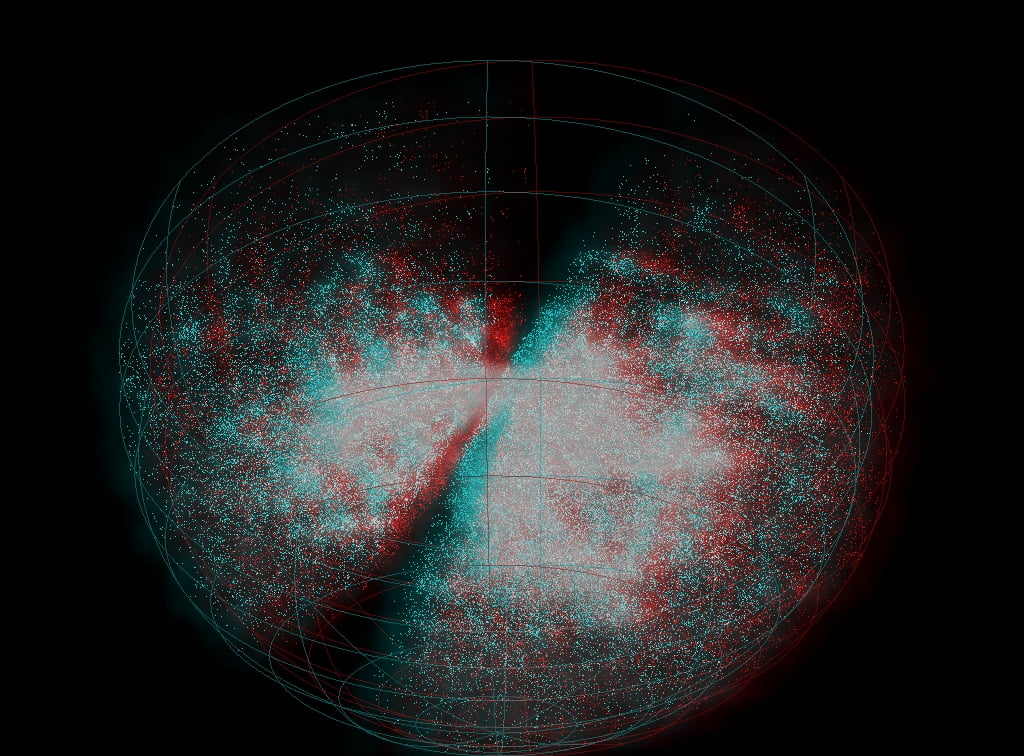
6df Galaxy Survey data, each dot is a galaxy and Earth is at the centre of the sphere.
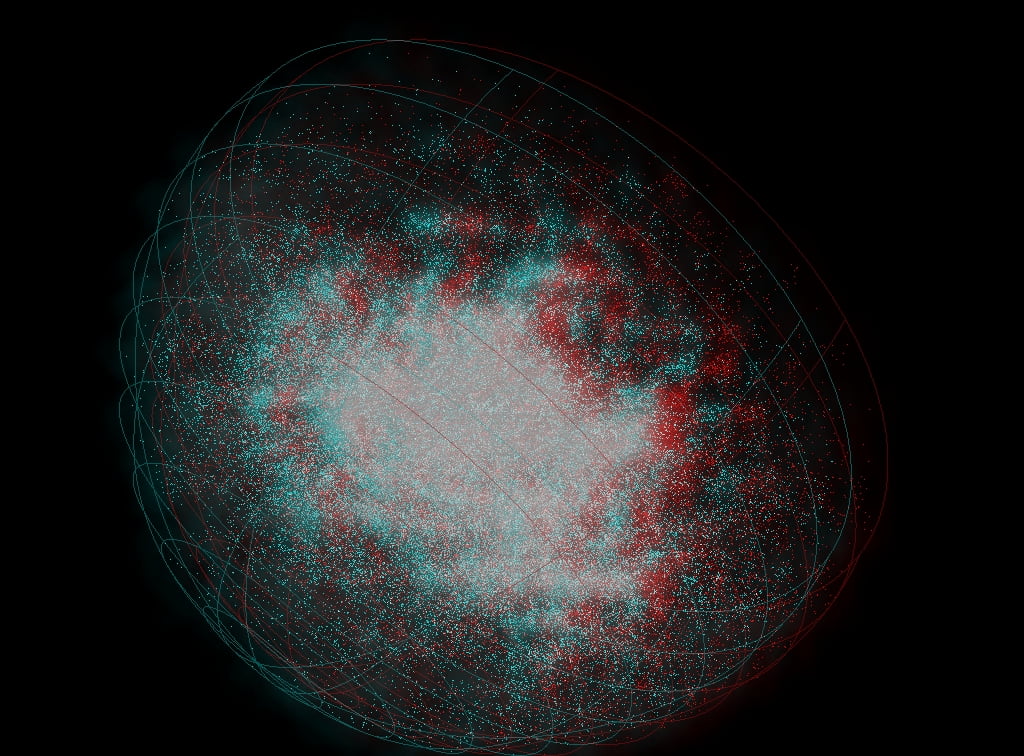
6df Galaxy Survey data, each dot is a galaxy and Earth is at the centre of the sphere.
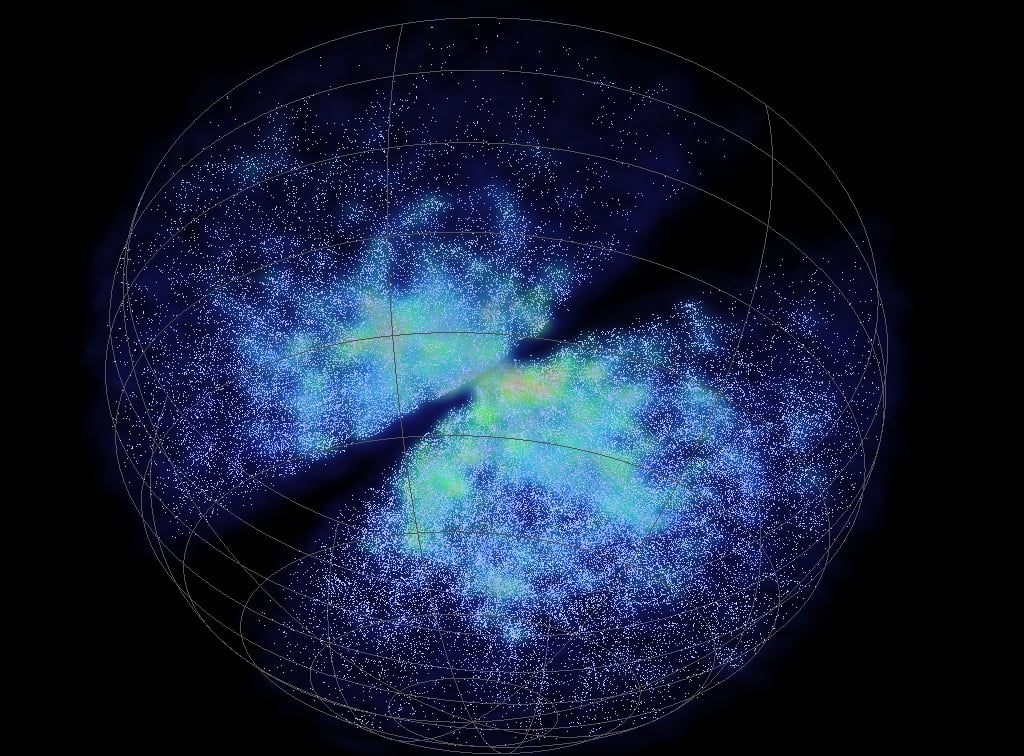
6df GS image 1.
6df Galaxy Survey data, each dot is a galaxy and Earth is at the centre of the sphere.
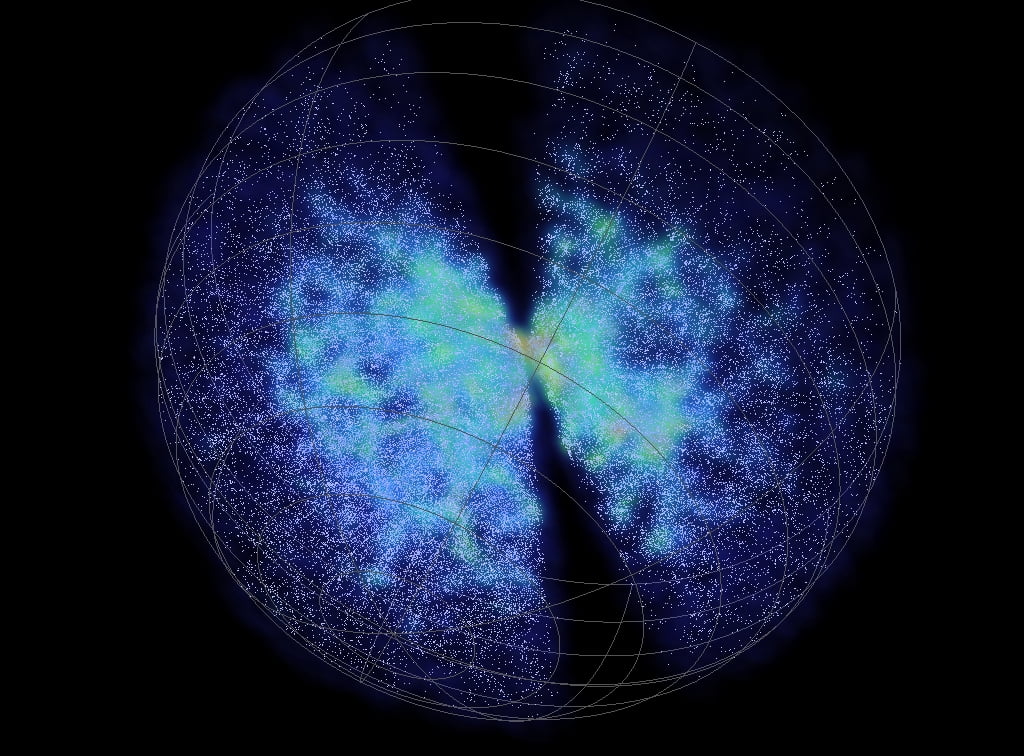
The 6df Galaxy Survey data, each dot is a galaxy and Earth is at the centre of the sphere. Created by Chris Fluke, Centre for Astrophysics & Supercomputing, Swinburne University of Technology.
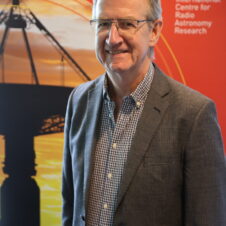
Mr Florian Beutler, ICRAR/UWA PhD Candidate, has calculated how fast the Universe is growing using a new method. Please credit all use of this image to: ‘ICRAR’ or ‘The International Centre for Radio Astronomy Research’

