ICRAR researchers are developing open-source calculators for use in astronomy and other scientific fields.
Located millions or even billions of light years away from the objects and phenomena they’re studying, astronomers rely on information gleaned from a spectrum of light gathered by Earth’s ground and space-based observatories.
A core part of an astronomer’s tools for probing the cosmos are their coding skills.
They must design bespoke algorithms to organise, visualise and interrogate enormous data sets that reveal the physical processes behind the formation and evolution of stars and galaxies, and the inner workings of complex systems over enormous timescales.
The code developed by ICRAR’s researchers is open source, made freely available to scientists working around the world.
This includes tools for measuring distance to an object, the mass distribution of dark matter, and even the star formation history of galaxies.
“By making our code available for others to use we’re providing a service for researchers working in astronomy and beyond,” said Dr Luke Davies, a senior researcher at ICRAR.
“These tools perform tasks we have to do all of the time.”
“Normally, an astronomer would write their own bit of code that they’d keep to themselves and call on whenever they needed it—which adds up to a lot of time spent recreating wheels.”
“By making these tools freely available to anyone that wants then, we’re standardising the way these tasks are performed and helping more research to get done overall.”
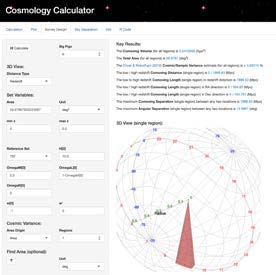
Associate Professor Aaron Robotham needed a tool to easily generate a suite of astronomical distances and cosmological properties for a custom set of parameters.
“Every time we ran scripts on our data, we’d have to calculate the same things over and over again, so I created CosmoCalc to do it for us and bolted on a user-friendly web interface to make it easy for anyone to use,” Associate Professor Robotham said.
“Many thanks for the CosmoCalc web tool. It is my go-to page for cosmological calculations and very useful for my research because it is so easy to use.”
Dr Johannes Buchner, Max Planck Institute For Extraterrestrial Physics (Germany)
 CosmoCalc calculates times and distances as a function of redshift—how light shifts toward shorter or longer wavelengths as objects in space (such as stars or galaxies) move closer or farther away from us.
“It’s incredibly useful and has been picked up by my colleagues throughout the world.”
“I use cosmocalc in my teaching. Specifically, in a tutorial, they have various questions to answer, including plots, concerning how quantities vary with redshift or time. It is very useful to demonstrate the integrals of the standard cosmological equations with mixed constituents.”
Professor Ivan Baldry, Liverpool John Moores University (UK)
Beyond Astronomy

Some of the tools developed by ICRAR’s researchers are being used for more down-to-earth applications. One example is SpherePlot, originally created by Associate Professor Robotham to plot the positions of stars and galaxies and map them onto different types of two-dimensional projections.

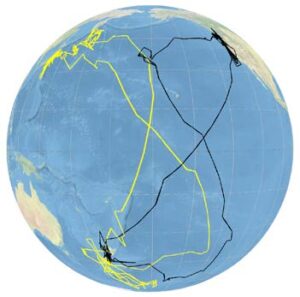
Tracks of two sooty shearwaters (Ardenna grisea) from their breeding islands off New Zealand, to their feeding grounds in the Antarctic, and during their migration to, sojourn in, and migration from, either side of the North Pacific. Data from Shaffer et al. (2007), PNAS.
Avian palaeobiologist Dr Richard Holdaway has adopted SpherePlot to visualise the routes taken by migrating birds as they travel from one part of the world to another.
“This tool has been an enormous help to my work,” Dr Holdaway said.
“Many analyses are done using standard map projections, and it is important to understand that birds (and other animals) move in spherical and not 2-dimensional space.
“It’s allowed me to map the flight paths of different species of birds and show how the routes the animals are taking, and when they begin their journeys, are related to the positions of the Sun and Moon.
“Visualising the data in this way allows analysis of a complex biological/astronomical interplay we’re only just starting to realise exists let alone understand.”
Other useful web-based tools
Astromap
A tool for generating maps of astronomical surveys. Researchers can choose data from a library of current and upcoming surveys or design their own survey layout.
 WhatsUp
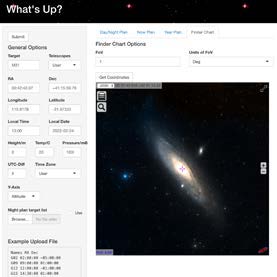
Modern astronomers often control telescopes remotely rather than travelling to and from observatories.This tool allows astronomers to know what objects are above the horizon at a given time from any location in the world.
PROSPECT
This allows astronomers to understand how heavier elements in galaxies have changed over time. Recently, this tool was used to model the energy and wavelengths of light coming from hundreds of nearby galaxies, reconstructing when most of the stars in the entire Universe formed.